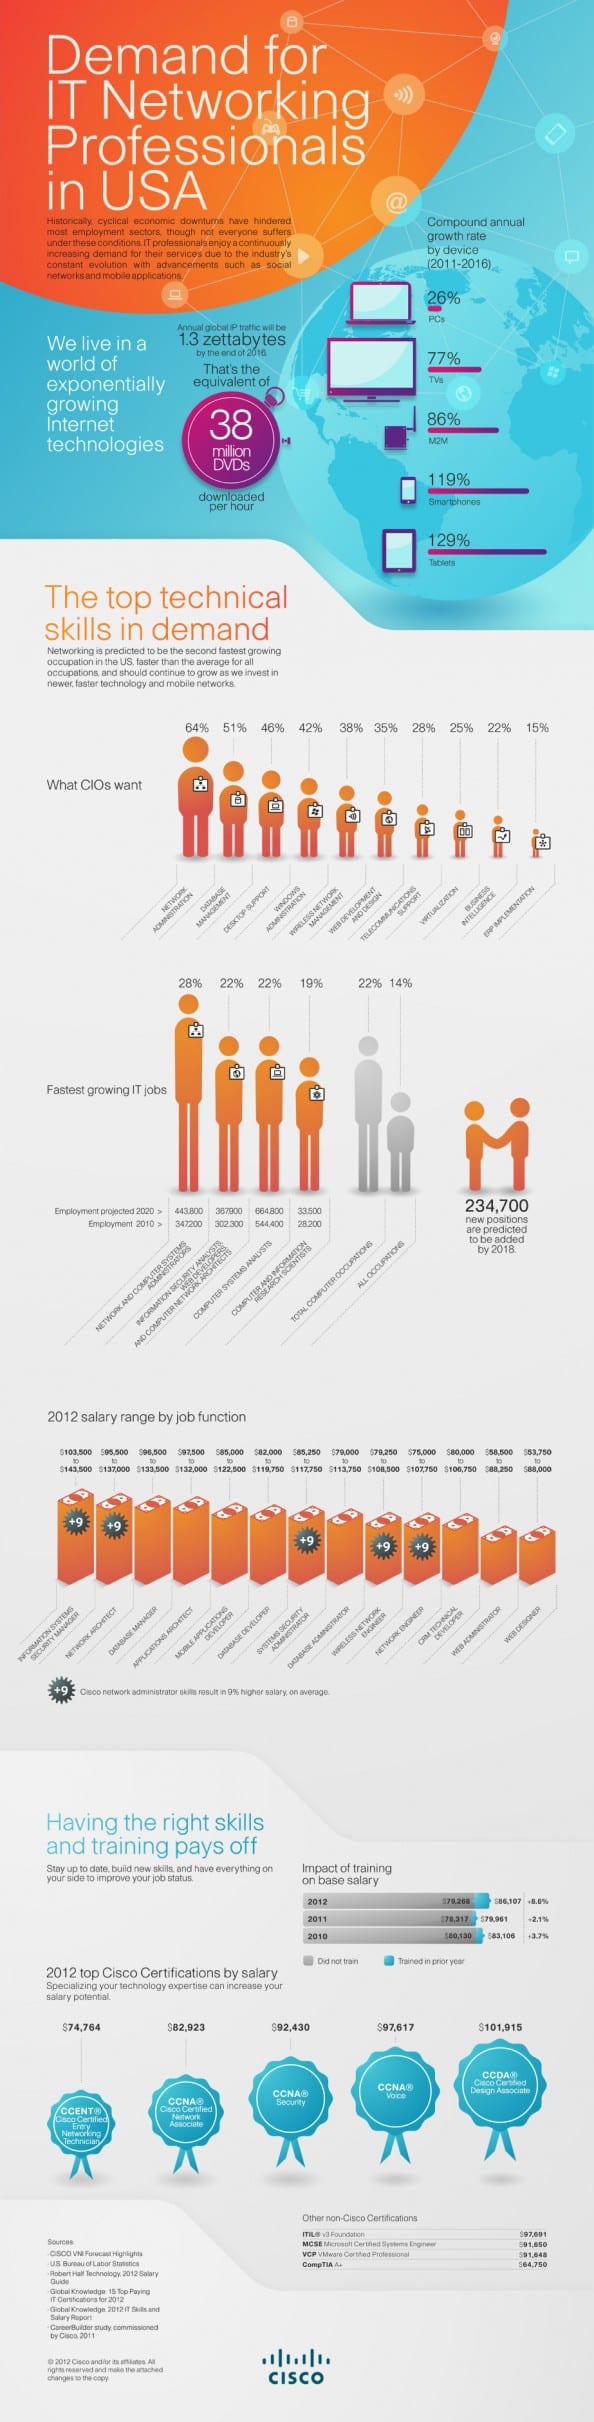
Here's an infographic that looks at what the future of tech holds in terms of in-demand skills. via Infographic


Experienced Technology Entrepreneur
Chief Encouragement Officer
Experienced Technology Entrepreneur
Chief Encouragement Officer
Here's an infographic that looks at what the future of tech holds in terms of in-demand skills. via Infographic
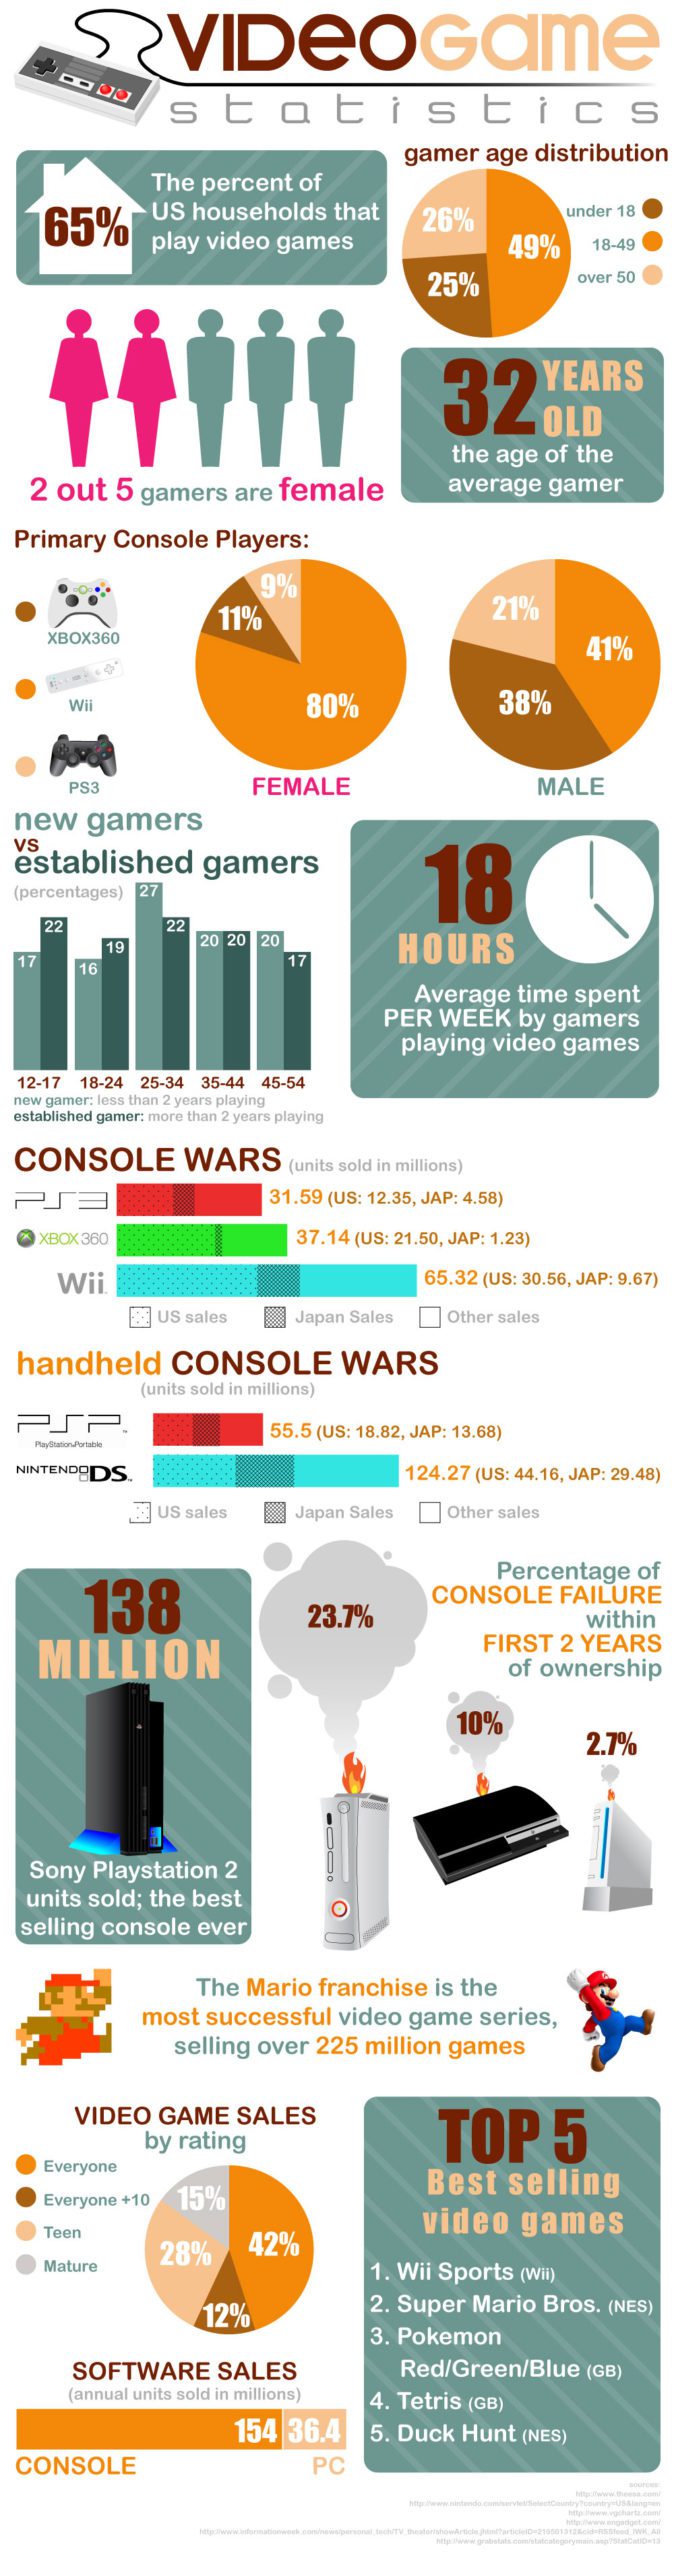
LOL - I have sadly exceeded the 'average age' for video game players - and NEVER averaged 18 hours per week of...
![Exactly how many App sales dose it take to Become a Millionaire [Infographic]](https://www.paulhelmick.com/wp-content/uploads/2011/03/millionaire-apps-hires-small-530x855-1.jpg)
It seems you have to sell more than 500 000 apps to achieve a gain of six zeros. The calculation was performed...
![The History of the Super Bowl [infographic]](https://www.paulhelmick.com/wp-content/uploads/2011/02/History_of_the_Super_Bowl-1.jpg)
via The History of the Super Bowl [infographic].
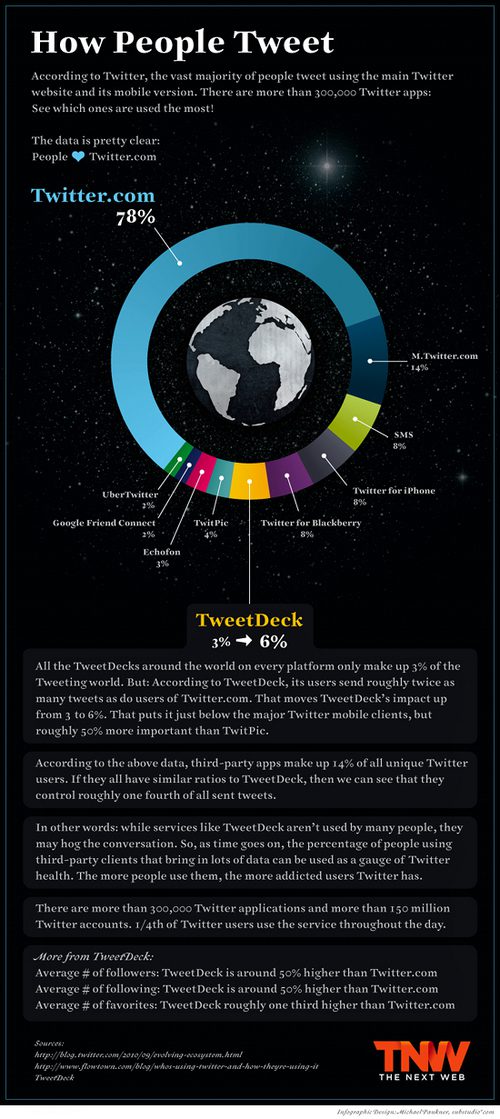
via How people tweet [infographic] - Holy Kaw!.
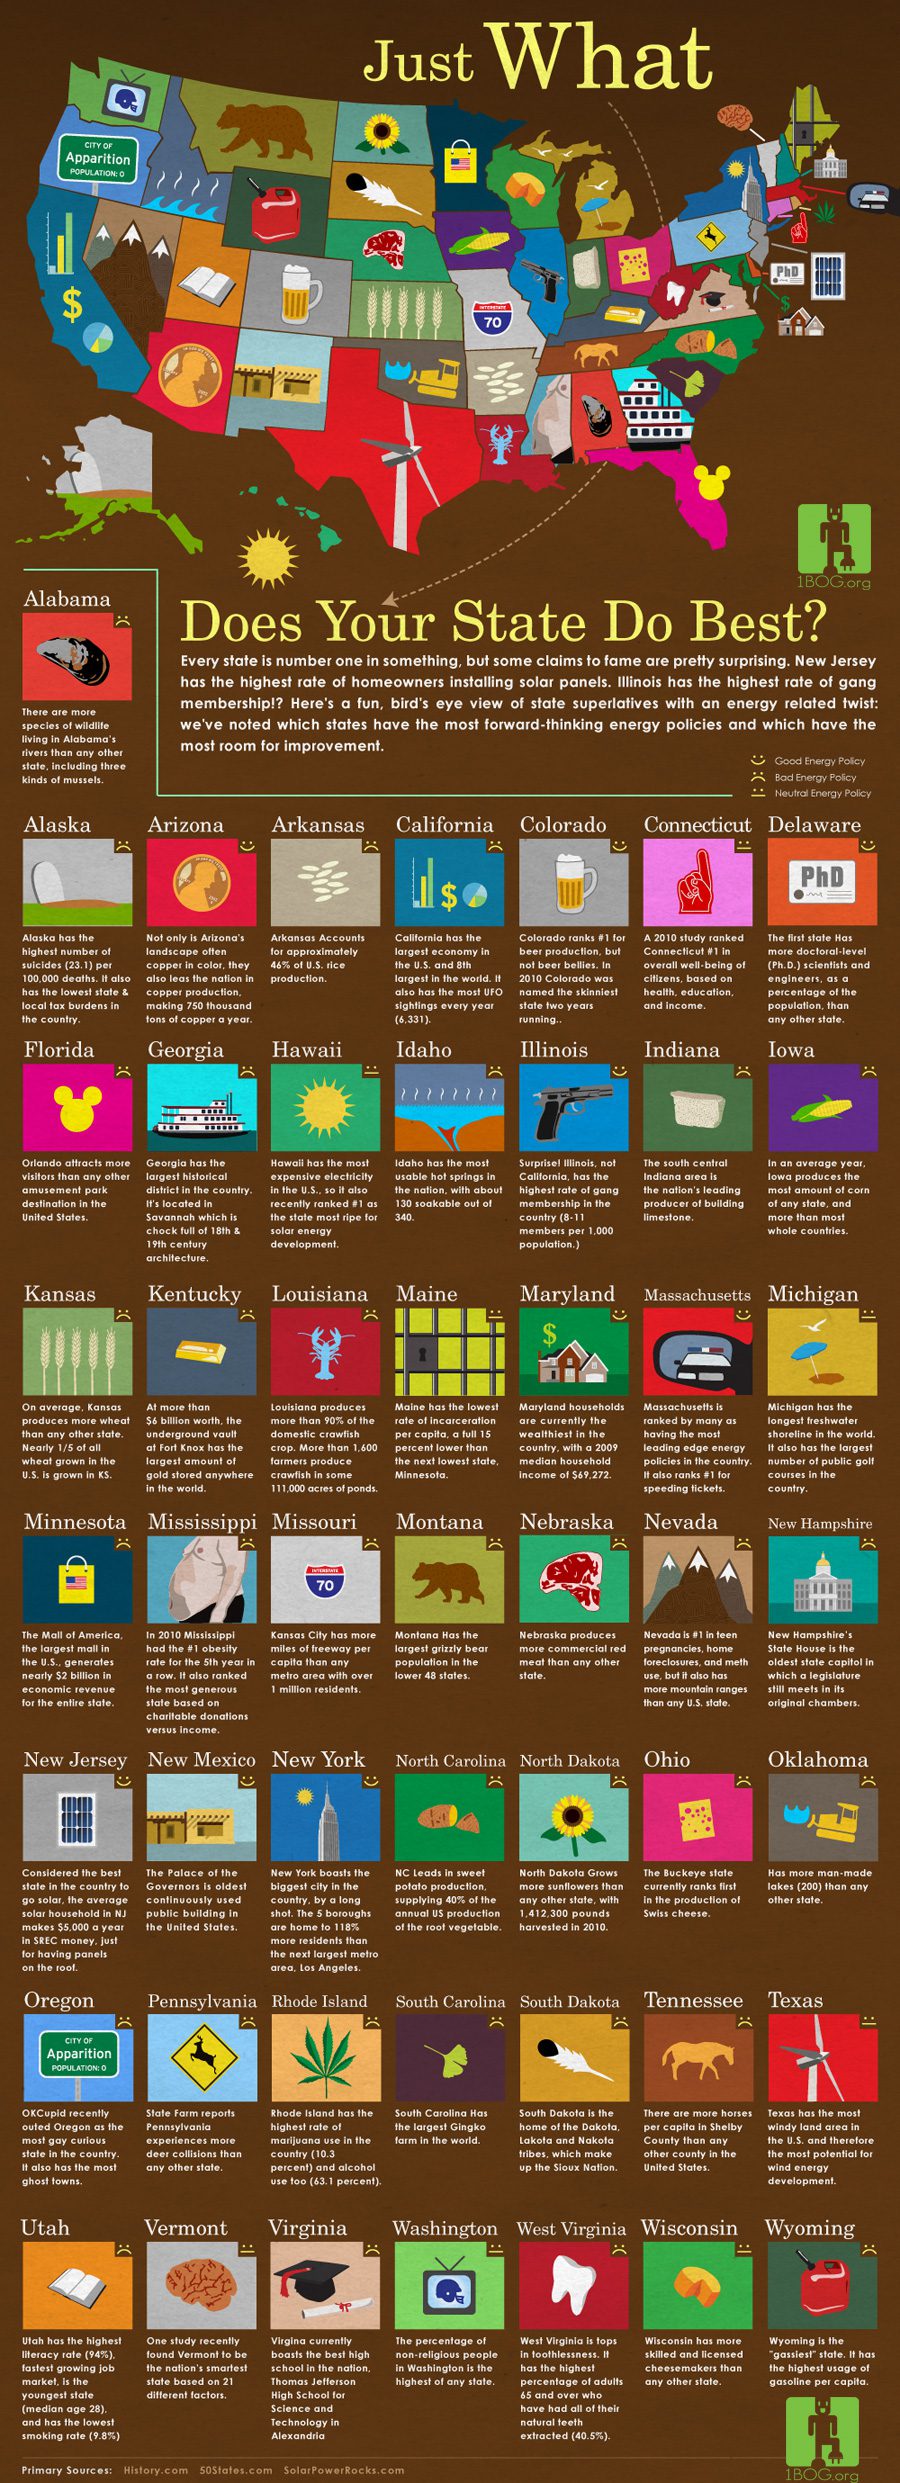
Just What Does Your State Do Best? | Fast Company.
![Homeschooling By the Numbers [infographic]](https://www.paulhelmick.com/wp-content/uploads/2010/12/homeschooling-infographic.jpg)
via Homeschooling By the Numbers [infographic].
![Facebook vs Twitter: By The Numbers [Infographic]](https://www.paulhelmick.com/wp-content/uploads/2010/12/facebook-vs-twitter-infographic.jpeg)
via Facebook vs Twitter: By The Numbers [Infographic].
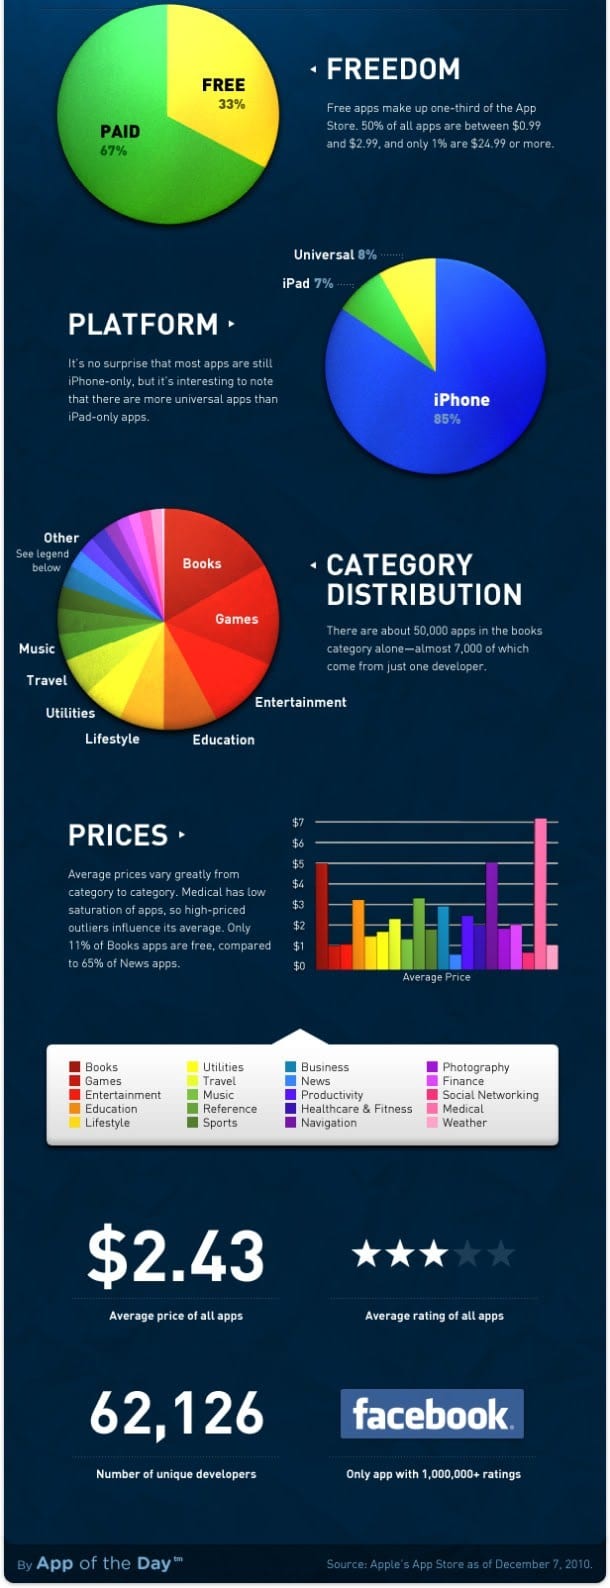
via The State of the App Store (Infographic).
via mint.com
![Coffee and the Global Economy [infographic] – Love this!](https://www.paulhelmick.com/wp-content/uploads/2010/12/media_httpdailyinfogr_DqrGH.jpeg.scaled500.jpg)
via dailyinfographic.com
![How to Survive Black Friday [infographic]](https://www.paulhelmick.com/wp-content/uploads/2010/11/media_httpdailyinfogr_HcIDe.png.scaled500.png)
via dailyinfographic.com First Come - First Served 🙂
![The State of B2B Social Media Marketing [INFOGRAPHIC]](https://www.paulhelmick.com/wp-content/uploads/2011/10/B2B-Social-Media-Marketing-Infographic.jpg)
One report found that only 32% of B2B companies engage with their customers on a daily basis via social media....
![Price Tag of the Top Ten Pets [infographic]](https://www.paulhelmick.com/wp-content/uploads/2010/11/media_httpdailyinfogr_eCmdJ.jpeg.scaled500.jpg)
via dailyinfographic.com Full story at: http://dailyinfographic.com/top-ten-pets-infographic#
![Fortune 100 Companies [infographic] Here is wow they use social media.](https://www.paulhelmick.com/wp-content/uploads/2010/11/media_httpdailyinfogr_rIwgb.png.scaled500.png)
via dailyinfographic.com
![Celebrating The History of Women in the Workplace [Infographic]](https://www.paulhelmick.com/wp-content/uploads/2010/11/media_httpcollegecand_DBDjc.jpg.scaled500.jpg)
via collegecandy.com
![Facebook User Numbers [infographic] all in LESS than 10 years!](https://www.paulhelmick.com/wp-content/uploads/2010/11/media_httpdailyinfogr_pdpwJ.png.scaled500.png)
via dailyinfographic.com
![All About Junk Mail [infographic] Will it ever go away??](https://www.paulhelmick.com/wp-content/uploads/2010/11/media_httpdailyinfogr_kbFGh.png.scaled500.png)
via dailyinfographic.com Will it EVER go away?
via thenextweb.com
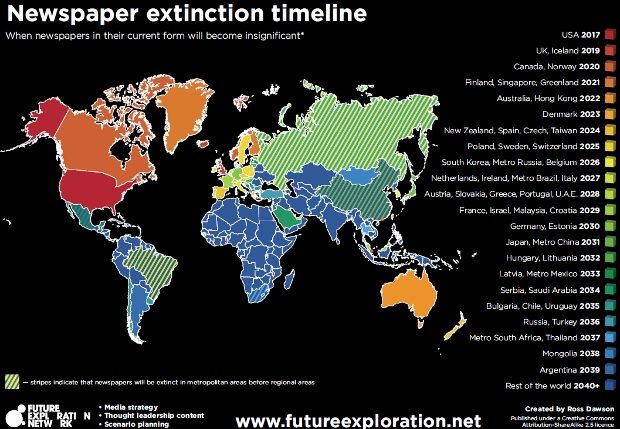
via thenextweb.com It’s widely accepted that the Internet will kill off printed newspapers, it’s just a question of...
via lifeinthefastlane.ca Thankfully I've never had to deal with this personally - but I've had several friends just...
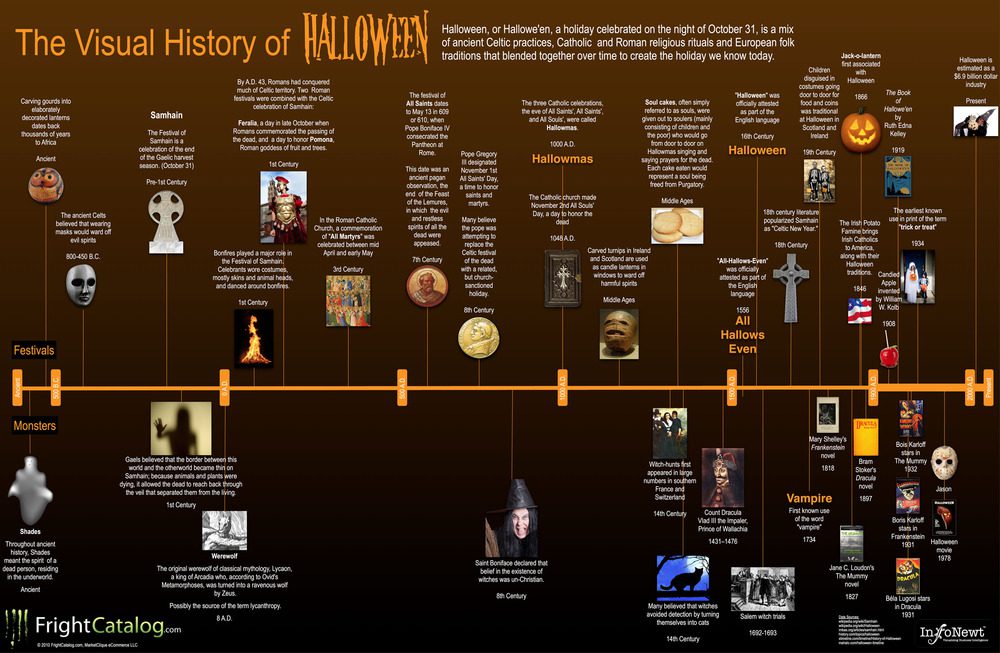
via frightcatalog.com
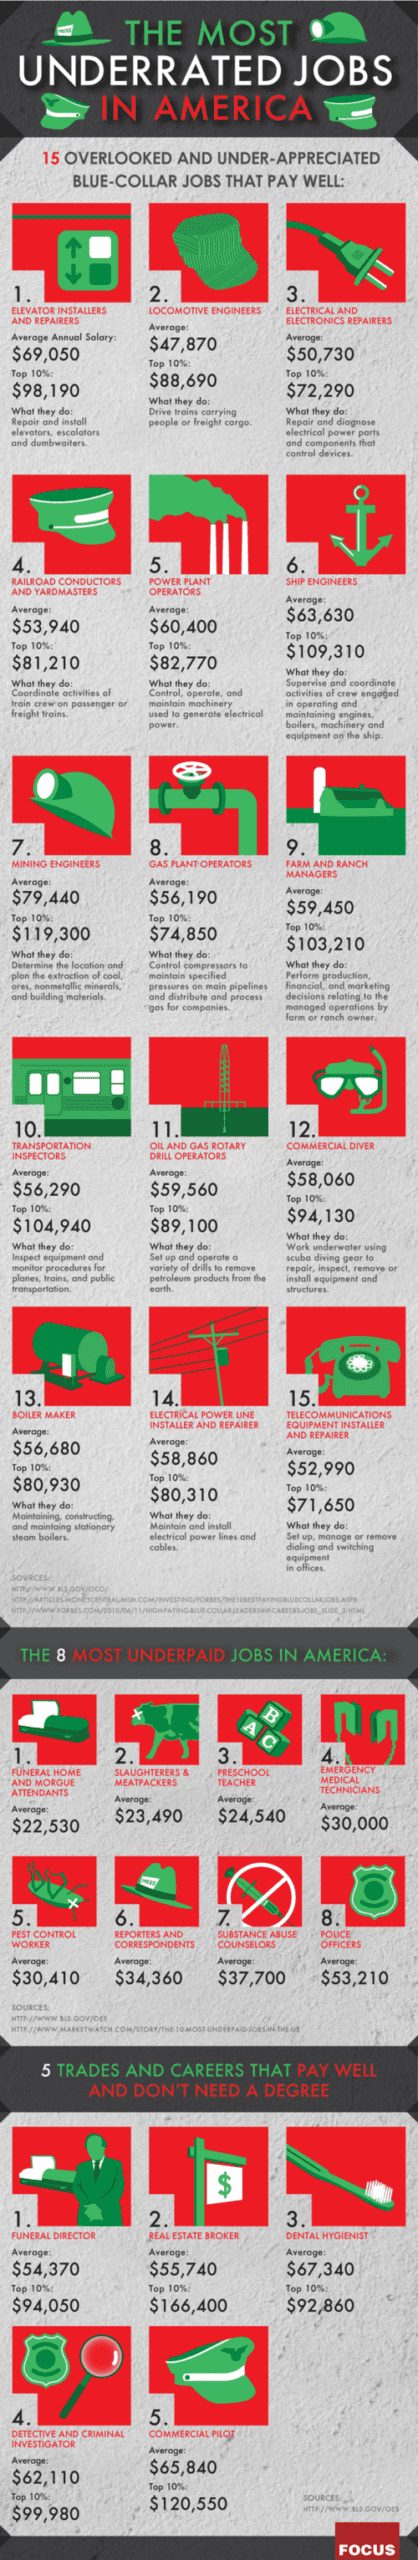
via focus.com
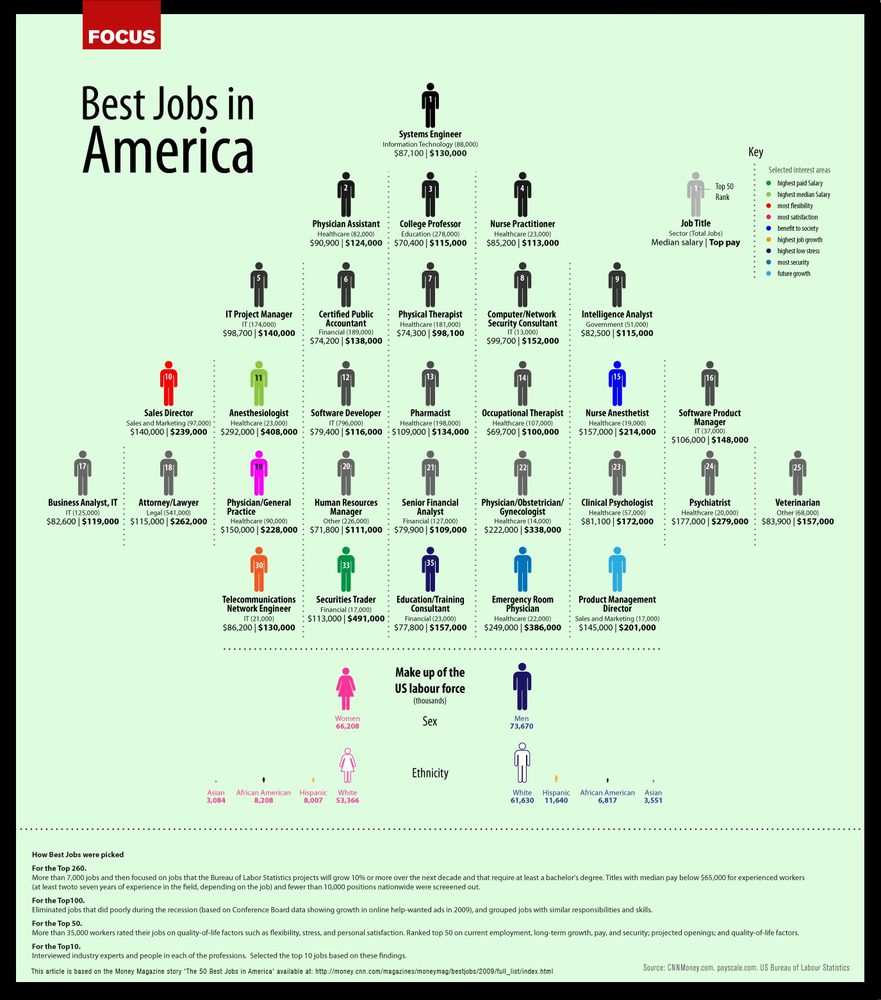
via focus.com